Thursday, August 2, 2012

8/2/12 Updates


In the last couple week I have been working on refining the graph in the visualization.  We are currently using a Flare graph.  However, it does not have some functionality that we would like. For example, the Flare graph does not display large instances very well.  This last week I have been researching other graphs that we could potentially use. I am currently looking into creating a graph component using MXML.  I hope to have a prototype of this new graph soon. 

In my other project, I have been continuing to read the current research done on no-good learning in CSP. I have implemented a couple algorithms determine if a new nogood is subsumed by one in the current list or subsumes a nogood in the current list and sort the no good list.

Thursday, July 19, 2012

July 19, 2012

In addition to our work with the SAT visualization, we have been interested in modeling real problems as Boolean satisfiability problems, particularly Sudoku puzzles. I have been working on a script that takes as input a Sudoku puzzle represented as a string (a sequence of each square's value, from top-to-bottom and left-to-right), converts it to its representation in conjunctive normal form,  and outputs a CNF file readable by MiniSAT.

When represented as SAT problems, Sudoku puzzles are very large (729 literals), but not overly difficult to model.
Sudoku puzzles in SAT require clauses specifying that:
-Every square may only hold values from 1-9, and each square may only hold one value.
-Every value must exist in every row, but must exist only once in each row.
-Every value must exist in every column, but must exist only once in each column.
-Every value must exist in each 3x3 square, but each value may only appear once in that square.
-Each square holding a value at the beginning of the puzzle must be asserted.

There is a fairly elegant literal encoding for Sudoku that makes it much easier to interpret the results of the SAT solver. A square in Sudoku can be represented as p(i, j, n), where i is the row, j is the column, and n is the value assigned to that square. Thus, the clause 234 asserts that the square in the 2nd row and the 3rd column is assigned the value 4. Negation works similarly; -235 asserts that 5 cannot be assigned to the previous square.

I am looking forward to seeing how MiniSAT handles these SAT instances and discovering what can be learned from testing our system on a real problem.

-Maggie

Project Updates (7/19)


At our meeting last week we discussed further changes that should be made to the visualization.  First we decided on the statistics that should be included in the graph: size of the partial solution, number of open clauses (separated into learnt and original), and number of learnt clauses (this excludes the ones that have been forgotten).  We then discussed how the page should be organized and decided that the textbox, graph, and tree should all somehow be coordinated.  To coordinate the three structures, I implemented a couple new features.  When the user hovers over a node in the tree, the 4 corresponding nodes in the graph blink to indicate the location and the textbox displays the corresponding statistics. Previously there was a slider bar that indicated the progress along the tree, however I think it may be easier to navigate through the tree using the nodes on the graph.  Thus, I disabled the sliderbar (it is still visible and marks the location on the graph, but the user cannot use it to navigate through the tree) and am going to make the nodes on the graph buttons so the user can simply click on the node in the graph to build the tree.  In the upcoming week, I will also be redoing the dropdown box.  The drop down box will contain the same statistics found in the graph.  The user will have the option to view one or all of the statistics.  When the user makes his/her selection the graph will be updated to show one or all of the statistics and, when the user hovers over nodes in the tree, the corresponding statistic(s) will be shown in the text box.
-Mary

Wednesday, July 11, 2012

7/11 Vis Update


Over the two weeks we have been working on getting a prototype graph to navigate through the tree.  We found several examples on the web and decided to implement one that used flare.  Right now our graph shows the currently unsatisfied clauses at a particular node.  I implemented functionality to navigate through the graph using the scroll bar.  Also the current state of the tree is reflected in the graph by boldfacing the node in the graph corresponding to the most recently added node in the tree.  Over the next week I will be gathering more statistics MiniSAT and adding more lines to the graph.   Eventually, I would like to have check boxes alongside the graph listing the statistics so the user could select which ones he or she would like to view.  In addition to the graph, I will be implementing a legend for the tree to describe the colors of the nodes.

-Mary

Monday, June 25, 2012

6/25/2012 Update


During our meeting last week we discussed ways in which we could refine our visualization. We tried to come up with several usage scenarios to guide our progress and make the tool more useful.  We plan to look at different aspects of the algorithm and try to implement a way in which our tool can demonstrate each part.  Dr. Dwyer suggested coming up with questions that we had when we first learned to algorithm then altering the tool to answer these questions.  This will help us keep sight of our goal to produce a helpful learning tool and give us a better guide to reach our goal. 

Additionally, Elena and Dr. Dwyer expressed interested in making the tool more user friendly.  Dr. Dwyer suggested that instead of having a combo box for every node we should consider having a static position for the combo box.  Instead of having to click several times to view information about a node, Dr. Dwyer suggested selecting a “mode” using the combo box and hovering over each node to retrieve the information.  This saves the user several clicks in order to get the same information. In addition to Dr. Dwyer’s suggestion, Elena recommended having pause/play buttons to build the graph instead of having to user the slider or clicking the right arrow to build.  This makes it much easier to see the graph being built incrementally.  Over these last couple days, I have implemented both of these features and cleaned up the flash builder code.

Finally, we discussed removing some of the clutter on the visualization.  Right now the user can select “Unsat Clauses” mode and view ALL of the unsat clauses in the text box on the side of the page.  This information is not very useful to someone learning the algorithm and can become very overwhelming.  The original intent for displaying all of the unsat clauses was to show how the amount of unsat clauses changes throughout the algorithm. We decided that it would be much easier to visualize the change in unsat clauses graphically and discussed the possibility of having a sort of timeline. We are currently looking at tools that we can use to display the timeline and graph.  Hopefully next week we will have made a decision regarding the timeline and can continue progress.

-Mary

Monday, June 18, 2012

Project Updates 6/18

At our weekly meeting last Thursday, Dr. Dwyer provided very helpful feedback on the current state of our visualization.  Some of his suggestions included adding a key at the bottom of the page and having a static location for the drop down box.  Having the drop down box in one place will allow the user to select a certain "mode" (conflict clause mode, propagations mode, or unsat clauses mode) then hover over the nodes to view the specific information.  Rather than having to select a new mode every time the user hovers over a node, the user can see how the information selected in the mode changes with each node by simply selecting a mode and hovering over other nodes.  This will make the visualization more user friendly.

As I mentioned last week, Maggie and I decided to split the work.  For the time being she will be working (and updating the blog) on the FlashBuilder portion and I will be working on the MiniSAT side.  So far, I have altered the MiniSAT code further to allow output of nodes involved in a conflict clause.  Previously in one of our meetings we discussing the possibility of having the nodes that led to a conflict light up when the user hovered over the conflict node.  The change I made to the MiniSAT code will allow Maggie implement this feature.

-Mary

Monday, June 11, 2012

June 11, 2012

We have finished refactoring the code and have put both the MiniSAT code and the FlashBuilder visualization code into an SVN so we can work simultaneously. The plan is for one of us to work on the MiniSAT code while the other is working on the Flashbuilder code.

Previously our visualization had a pop up text box for each node. This text box appeared the user hovered over the node with the mouse.  The text box displayed the propagations associated to that node and the conflict clause if the node was a dead end.  This text box looked very nice when there were a small amount of propagations, however if there were too many propagations it seemed to get a little cluttered. Early in May we discussed the possibility of adding a drop down menu when the the user hovers over the node as a fix for the clutter.

We implemented this feature this last week.  The drop down menu includes the following options: Propagation, Unsat Clauses, Conflict Clause. In a text box off to the side (the text box that previously showed the unsat clauses for a node when the graph was being built) the selection is shown.  Below is an example where the "Propogation" option was selected from the drop down box of node -14 (note that the graph is only partially built):


As shown above, the slider bar indicates the progress of the graph and can be used to add or remove nodes.

As with the slider bar and the scrollbar, the combobox has some issues getting and losing focus.  I will continue to work on this issue, although it may require us to look for a different library or toolset.

-Mary

Monday, June 4, 2012

June work

Last week we decided in a summer meeting schedule so we can be more consistent. We plan on meeting as an entire group every Thursday. In addition to these meeting times Maggie and I will likely meet on a regular basis to discuss progress via Skype or in person. This week we are working on refactoring both our flash builder code and our MiniSAT code. We would like to begin working on the same code base to expedite the progress. While it has been good experience creating our own code and seeing how our implementations differ, I think it will be very beneficial to work on the same code base. We will have to be more organized with dividing tasks but I think we will be able to cover more ground this way. Additionally, since we began by implementing tasks individually refactoring our code gives us the opportunity to combine ideas and take "the best of both". Mary

Tuesday, May 29, 2012

5/29


This last week I’ve worked on making the visualization more user friendly.  Previously I was having an issue with the scroll bar I added to the clauses textbox.  Since I had also attached the graph to a Pan Zoom Control, when I was scrolling the text box I was also moving the graph!  After a little reading and some trial and error the problem has been fixed.

We discussed in one of our earlier meetings the possibility of adding a slider bar to indicate how the progress of the graph.  The user can still build the graph using the left and right arrows, however if the graph is very large, building the graph can take a long time. These large graphs are the main reason we decided to implement the slider bar.  The user is now able to use the slider bar to build the graph.  This is a very nice feature that has been implemented; however it needs a little bit of work yet.  There is some difficulty getting focus on the slider bar when the program is first launched. I will continue working on this issue throughout the week. We have a scheduled meeting this upcoming Thursday to discuss what the final visualization will include (since the deadline is only about a month away) and begin designing the poster for the poster session at Grace Hopper 2012.

Wednesday, May 23, 2012

May Updates


We had our closing semester meeting during the first week of May.  During that meeting we delegated tasks which would be accomplished over the summer.  For the visualization, Maggie and I will add in the conflict clauses.  I have begun implementing this portion.  As of now, when a dead end is reached in the visualization if you hover over that node a box shows up alongside the node listing the propagations and the conflict clause added.   We also discussed the possibility of displaying the implication graph for each the dead ends.  I have not implanted that functionality yet but I hope to have that completed for the final demo.  At our meeting in early May we discussed adding a text box that shows all of the currently unsatisfied.  This feature will basically let the user visualize the impact of each assignment.  I currently have this implemented in my visualization.  I separated the unsatisfied original clauses from the unsatisfied learnt clauses.  At one point we also discussed have a text box for each node with statistics such as number of unsatisfied clauses, number of satisfied clauses, etc.   I will be discussing this with Dr. Dwyer at our meeting whether or not we want to implement this. 


In addition to the visualization, I have been continuing my reading for the conflict clause learning. 


Our visualization poster was accepted to the general poster session at Grace Hopper J, so we will begin authoring that probably within a week.

-Mary

Tuesday, April 17, 2012

4/17 Update

This last week we spent time learning the Simplex Method as a part of our understanding of SMT.  We looked at both the classical and general simplex methods.

On the visualization side, we modified our MiniSAT code to output a file which can be read by flashbuilder to produce a graph.  We built and colored the graph based on this output file.

For example with a tab delimited output file we generated the following graph:

The labels in each node indicate the assumption made at each set of the SAT solver.  The colors indicate if the assumption made at that node and the associated propagations participate in a solution (green), aren't part of the solution (grey) or correspond to the addition of a conflict clause and a dead end (red). The root node "r" simply indicates the root of the graph. Each of the graph levels corresponds to a decision level.  For example the node "-1" corresponds to the decision level 0.  Further, when the mouse hovers over a specific node, the propagations associated with that node's assumption are displayed in a textbox below the node.  For example the assumption"19" has associated propagations -3,-7,-9,17,-14 as shown below:

On my own project, I am continuing to read the current reseach to get a better idea of how to approach the problem.

-Mary

Tuesday, April 10, 2012

April 10, 2012

Recently, we have been working on implementing an interactive SAT visualization using Adobe Flash Builder and the Flex libraries. In the past several weeks, we studied Flash Builder demos and worked on isolating a tree structure. We then worked on making it possible to zoom in and out on different areas of the graph and worked on populating the nodes with data. We then worked on parsing data and using that data to construct the tree. Our current task is to parse the data output by the SAT solver and build an interactive tree representation of the search space. Our hope is that the tree will be able to represent decision levels, assumptions, conflict clauses, and backtracking.

On the theoretical side, we have been studying chapters 3, 4, and 9 of Decision Procedures by Daniel Kroening and Ofer Strichman. Our plan is to learn the theory behind SMT solvers, our next area of focus.

-Maggie

Tuesday, April 3, 2012

April 3, 2012

This week we are working more on the visualization of the MiniSAT solver. We are loading sample files and creating arrays based on the information in the files.  We are also continuing to discuss our approach on how to move forward with the visualization.  On my own project, I am continuing to read the research that has already been done in the area in order to get a better idea of how I should approach the project.

Tuesday, March 27, 2012

March 2012

Throughout March we have read chapters 3 and 4 in the book Decision Procedure and have been discussing the content in both our small and large group meetings to better understand the content.  Also, Maggie and I have been working with Elena on the visualization of the MiniSAT algorithm.  We decided to use Flash Builder and Flare for this visualization.  So far we have been going through the examples provided from the flare.prefuse.org website to get better idea of how to implement our visualization.  We figured out the zooming capability and have created our own trees using Flash Builder.  In addition to the SAT/CSP project, I have been working on my own project for conflict analysis in CSPs.  So far on this project I have created a variable ordering specifically for the zebra problem which selects one variable per cluster and jumps across clusters.  The purpose of this variable ordering is to study how CBJ identifies the constrains and creates the conflicts.  Additionally, I have implemented a piece in my code which takes a pre assignments and searches for a solution based on the partial assignment.  From here, I plan to read the relevant research which has already taken place regarding conflict analysis in CSP to build a better intuition of the material.

-Mary

Tuesday, March 6, 2012

February, 2012


This semester, we have been working on becoming familiar with SAT solvers and methods. In learning how SAT solvers work, we have begun to explore the parallels between SAT solvers and CSP solvers, which can be used to solve the same problems but use different modeling techniques and search methodologies.

In order to delve into SAT, we have been exploring a well-known solver called MiniSAT (http://minisat.se). In order to understand how MiniSAT works, we traced the functions of the program and printed out the assumption and trail at each decision level. In order to parse the MiniSAT code more effectively, we read a paper by Niklas Eén and Niklas Sörensson, the creators of MiniSAT. The paper, titled “An Extensible SAT-solver”, explains the basic functionalities of the solver’s classes and methods as well as an overview of its core algorithms. It has been immensely helpful in understanding how MiniSAT propagates, learns conflict clauses and traverses the search space.

Recently, we have been working on a visualization of the MiniSAT search process. Using the dot graphing language, we can program MiniSAT to output dot code to a file, with each assumption represented as a node in a tree, and with backtracking being represented as separate branches of the tree. This exercise is very rewarding in that it provides a simple graphical interpretation of SAT solving. Once able to output dot code during the program’s runtime, we are working on storing information relevant to outputting the graphs nodes and branches into data structures that we can then store in our modified MiniSAT code. 

--Maggie

Saturday, February 25, 2012

Update

Sorry for the delay! Our group has been busy reading a paper describing the implementation of MiniSAT (http://minisat.se/downloads/MiniSat.pdf).  We've tried to carefully dissect this paper to understand the how it solves SAT problems.  So far we have made very good progress on this task and have a decent understanding of how it works. We have also adjusted the MiniSAT code so that it outputs a file that we can run on a dot renderer to produce a primitive graph.  We spent a lot of time designing the graph and each implemented our own sort of graph.  We presented our graphs to our advisers who gave us input on them.  We just implemented a data structure that holds the node information of the graph.  Our plan is to finish polishing up the graph and then move toward the animation. 

-Mary

Monday, February 6, 2012

Week 4 Update

During week four we tried to compile MiniSAT on our own laptops and tried to get started using and IDE (VisualStudio 2010 or Eclispe).  In the past I've found that using one of these IDE's dramatically decreases the time I spend debugging and programming in general.  However, I've run into issues with libraries so I haven't quite been able to start programming using one of the IDE's, as of now I'm still using Notepad++.  Also this week we started iintroducing print statements to the MiniSAT code to visualize how it is solving the SAT and began testing it on small, simple problems.  We were able to see where MiniSAT was making "assumptions" (instantiating a variable) and propagating other variables based on these assumptions, but we couldn't find a problem where we were able to see  MiniSAT backtracking.  We tried several Unsat problems with 100 or 200 variables and several constraints with no luck.  Fortunately, Dr. Dwyer found a SAT visualizer that came with a file that backtracked so we finally have been able to see how MiniSAT backtracks :).  We still want to make our own visualizer and will this upcoming week discuss what we like and don't like in the visualize Dr. Dwyer found (DPVIS – A Tool to Visualize the Structure of SAT Instances ). 

Further, Dr. Choueiry suggested that we look at how cconflicts are identified by CBJ,  test whether those conflicts are discovered more than once during search, and test whether they are global.  Perhaps this will be the topic of one of our posters :).

-Mary

Monday, January 30, 2012

Week 2-3

These last few weeks we have continued our discussion about SAT problems.  After understanding the format of the benchmark problems and running into a few issues compiling MiniSAT, we finally got the benchmark problems to run on MiniSAT AND produce the correct results :).  We decided our next task is to dig into the MiniSAT code and try to understand how it works to solve the problems.  To do this we decided to form a graph displaying what steps the solver is taking to solve each benchmark.  We are in the process adding code to MiniSAT so that the graph is generated when the as the problem is being solved.  Eventually what we would like to do is have a sort of animation of how MiniSAT is solving a problem.  Right now, we are working to get the code compiling on our own computers (not using the CSE remote computer).

-Mary

Friday, January 13, 2012

Week One (Second Semester)

This week we started our weekly meetings again.  This semester we are planning on meeting twice weekly as a group.  Our meetings this semester will be more discussion based in comparison to last semester. This semester we are starting the SAT side of our research and including Elena and Dr. Dwyer in more in our discussions.  We have started comparing some of the techniques of both fields and are noticing that a lot of the same concepts exist in both fields.  For example a BCP (Boolean Constraint Propagation) in SAT is similar to the domino effect in CSPs.  For the first week we decided to explore SAT using a SAT solver, particularly miniSAT. As of right now, I have downloaded it and (finally) figured out how to compile it.  I plan on looking at some benchmark problems and trying to understand how it works J.

Sunday, January 8, 2012

Kick-off meeting for Spring 2012

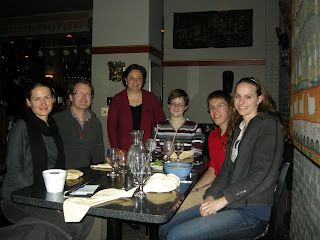
The entire team (2 ugrad students, Maggie and Mary, 2 grad mentors, Elena and Robert, and 2 faculty sponsors, Matt and Berthe) met for a relaxed meeting on January 6, 2012 at the Oven (Indian restaurant).  We discussed what was accomplished during Fall 2011 (where we focused on studying fundamental CP concepts and implementing search, backtracking, and consistency algorithms).  We agreed to start Spring 2012 by reverse engineering MiniSAT (SAT solver), studying SMT solvers, then diving into the study of constraints that arise in program analysis.  We will be meeting twice per week.  Most likely as follows: Once as a team to discuss progress and once as a smaller team to read tutorial papers.   Below is a photo of the super team taken at the Oven.  From left to right:  Elena, Matt, Berthe, Maggie, Robert,  and Mary.


Tuesday, January 3, 2012

End of semester meeting, Dec, 22, 2011

On December 22nd, 2011, we met at the Oven (Indian restaurant) for a relaxed brainstorming meeting.  Dr. Dwyer was in South Africa and could not join us.  Elena Sherman (graduate mentor) came to the restaurant, looked around for us, but could not find us although we were seated at the entrance (mishaps occur...), and left :-(   We are sorry, Elena, but we will coordinate better next time.  Were able to attend:  Mary, Maggie, Robert (graduate mentor), and Berthe.  During the dinner, we discussed the joys and difficulties of the fall semester and decided to delay any discussion about the Spring semester to another meeting that Matt and Elena can attend.  After the dinner, we took the photo below, which shows, from left to right, Robert, Mary, and Maggie.  Berthe took the photo.